We’re Bearish on Fear
Lucas Downey, Contributing Editor, TradeSmith Daily
Bears just can’t catch a break.
Watching the S&P 500 go up week after week… over 12% higher in just the first five months of the year… It must be tough when you’re pounding the table for a crash.
Well, they may be down, but they’re not out. The Negative Nancys are still out in full force, spinning new tales to scare investors out of stocks…
One of the latest doom charts being passed around is the super low reading of the CBOE Volatility Index (VIX)… also known as Wall Street’s “Fear Gauge.”
The VIX measures the near-term implied volatility of the S&P 500. It fell to pre-pandemic lows as investor anxiety has practically vanished. And some are pointing this out as if it’s something to worry about!
Conventional wisdom may have you believe that now’s the time to batten down the hatches and get ready for another shock crash.
However, before you make the decision to send your stock horses out to pasture, let’s turn to history and learn about the low-volatility regimes of the past…
Today, we’ll size up the current state of market volatility. Then we’ll review just how rare a low VIX reading is. And finally, we’ll investigate an evidence-rich study that will shed light on what’s likely ahead for stocks.
My bet is the results will surprise you…
And we’ll help you pack your bear spray.
Because there’s a long and fulfilling hike up the mountain ahead for you – and your portfolio.
The Only Thing Crashing Is Fear
There’s no other way to say it, market uncertainty is extremely low right now.
Ever since the painful pandemic of 2020, the VIX has been on a steady decline.
Friday’s close of 11.99 marked a milestone: the lowest VIX close since Nov. 27, 2019 when the fear gauge clocked 11.75:
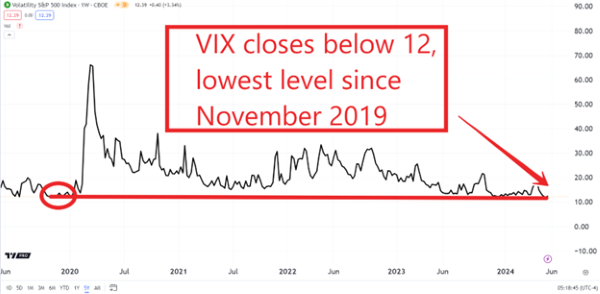
One look at this chart may cause jitters at first. After all, this nearly 5-year window gives the appearance that:
- A low, sub-12 reading in the VIX is rare.
- The last time we saw this level, high volatility came soon after.
But there’s a lot more history to consider than just these five years!
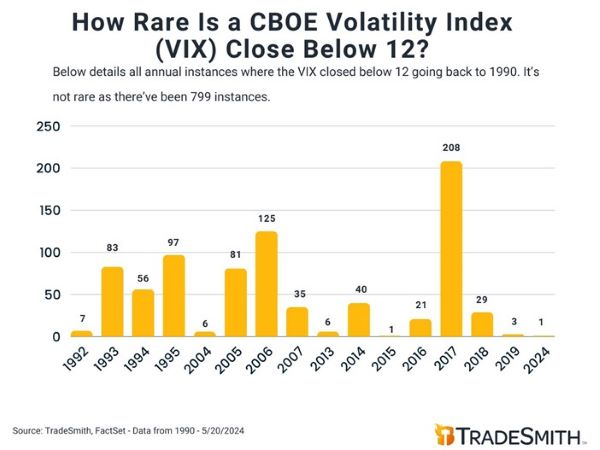
When you roll back the tape further, you learn that a VIX close below 12 isn’t as uncommon as it seems. In fact, going back to 1990, it’s happened 799 times.
- It happened just 3 times in 2019.
- In 2018, we saw it 29 times.
- In 2017, it happened a humongous 208 times. That was a year when just about all stocks danced higher, day after day.
The chart below shows all the sub-12 VIX closes back to 1990. This historical context should show you why the latest media-induced bear bait is nonsense:
Now that we’ve put some much-needed context on this latest event, you can breathe that sigh of relief. The world probably isn’t set for doom and gloom.
In fact, history says we are due for a BOOM!
But don’t just take my word for it. Let’s see the proof.
Low Volatility is a Bear’s Worst Enemy
While it’s true that the ultra-low volatility reading is unique to the past few years… it’s not a reason to sell stocks.
In fact, it’s a reason to hold your stocks… and consider buying more.
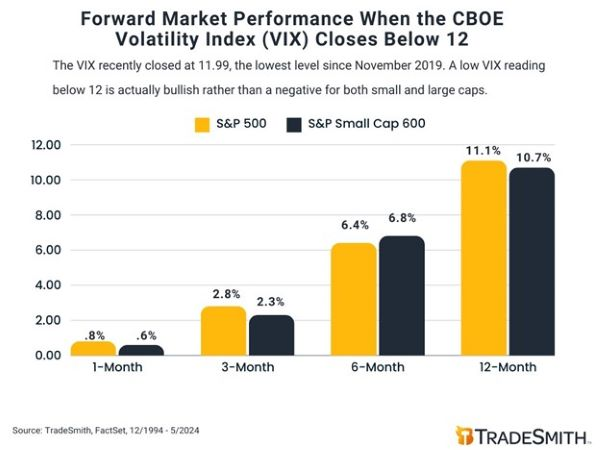
Because going back to 1990, whenever the CBOE Volatility Index (VIX) closes below 12, markets show healthy gains for months after.
For this study, I not only compiled all forward returns for the S&P 500, but I also included small-caps – using the S&P Small Cap 600 index as a barometer.
This way, we can measure the full market tide after an ultra-low volatility reading.
Bears should run in fear, because when the VIX closes below 12:
- 3 months later, the S&P 500 jumps 2.8% while small caps climb 2.3%.
- 6 months after, large caps rip 6.4% and small caps juice 6.8%.
- Be bold with a 12-month hold, and you’re staring at an 11.1% leap for the S&P 500 and a solid 10.7% gain for the S&P Small Cap 600.
For those keeping score, these are market-beating returns that dove-tail nicely with plenty of other TradeSmith studies signaling higher prices on the way, including the rare 6 consecutive up days for the S&P 500, and the beginning of seasonal strength hitting in late May.
In short, don’t buy into the bearish rhetoric… instead, buy into amazing stocks.
There’s a rebirth happening in the markets, Certain stocks are poised to double, triple, and more in the coming years. And TradeSmith offers world-class data and analytics to help you spot those massive opportunities early.
Kind of like how Jason Bodner’s Quantum Edge Pro service helped investors spot one the best stock opportunities in years, Super Micro Computer (SMCI) – before the epic rise!
So yes, volatility has collapsed.
Now history says, “go buy stocks!”
Regards,
Lucas Downey
Contributing Editor, TradeSmith Daily